
Publications
𝐀 𝐂𝐎𝐍𝐅𝐄𝐑𝐄𝐍𝐂𝐄 PAPER AT 𝐓𝐇𝐄 𝐋𝐄𝐕𝐘 𝐄𝐂𝐎𝐍𝐎𝐌𝐈𝐂𝐒 𝐈𝐍𝐒𝐓𝐈𝐓𝐔𝐓𝐄 𝐎𝐅 𝐁𝐀𝐑𝐃 𝐂𝐎𝐋𝐋𝐄𝐆𝐄, 𝐍𝐄𝐖 𝐘𝐎𝐑𝐊
“𝐓𝐢𝐦𝐞 𝐔𝐒𝐄 𝐚𝐧𝐝 𝐄𝐜𝐨𝐧𝐨𝐦𝐢𝐜 𝐖𝐞𝐥𝐥-𝐛𝐞𝐢𝐧𝐠” 𝟐𝟖 – 𝟐𝟗 𝐎𝐜𝐭𝐨𝐛𝐞𝐫 𝟐𝟎𝟎𝟓
From National Satellite Accounts of Household Production to Macroeconomic Modeling in African Countries
Alfred LATIGO, Omar ABDOURAHAMANI, Neijwa MOHAMMED, Ismael FOFANA, Bernard DECALUWE, John COCKBURN
Abstract
The lack of gender disaggregated data (GDD) on the household economy has been a major bottleneck, both at national and regional levels, in the process of designing, monitoring and evaluating policies and strategies such as for poverty reduction and Millennium Development Goals. Generally, conventional economic statistics exclude the undeniably valuable output of services by the household economy and the enormous volume of non-market work (NMW). Thus, macroeconomic frameworks including national accounts, budgets and policies are based on only market economy, which is known to constitute just 50% of the total economy. To redress this situation, the United Nations Economic Commission for Africa (ECA) in 2001 embarked on supporting selected African countries in collecting gender disaggregated data (GDD) on household production through conventional time-use studies and continuous household surveys with the aim of establishing African System of National Time Accounts (NTA) and National Satellite Accounts (Input-Output Tables) of Household Production (NSAHP). These accounts are in turn intended for extending standard national Social Accounting Matrices (SAMs) as databases for constructing gender-aware macroeconomic models to evaluate impacts of policies on poverty reduction and welfare. This paper discusses on-going work on a set of country studies on generation of new and more accurate figures on household production and services to improve policy formulation, modeling and forecasting of African economies. The paper starts with description of conceptual and methodological aspects leading to building a gender-aware macroeconomic model from NTA and NSAHP. It then presents NTA, NSAHP, gender-aware SAMs and model for South Africa. The NTA shows that women have 30-50% less time for personal care and leisure than men at the household level. Simulations using the model showed that because of the many competing demands, women continue to suffer from heavy time burden - they spend roughly three times as much time in household production and services as men. The NSAHP also shows that household production constitutes about 44% of the total economy, which is not included in the GDP assessment. The policy simulations using the model show that trade liberalization would increase the real wage rates and the labour market participation more for male workers than female workers with overall direct welfare loss for all workers but with women loosing more.
1. Introduction
The United Nations Economic Commission for Africa (ECA) has embarked on introducing in African countries a new round of continuous annual time-use surveys, which are cost-effective studies of a representative sample size of not more than 5,000 households per country. African countries do not conduct regular time use studies, which are emerging as a very useful statistical tool for collecting detailed information about how individuals spend their time, on a daily and weekly basis as an input to estimating the value of paid and unpaid work as well as the size of labour force in a country. Only six African countries have by 2005 conducted time-use surveys – most of which have not provided timely and adequately the required gender disaggregated statistics, which are not fully comparable between and within countries and may therefore be difficult to replicate to other countries. There is now a strong sentiment from the international community that the lack of time use surveys in countries from which to measure the value of unpaid work is a significant data gap in statistical systems. Thus, the economic and social development discussions and policy decisions fail to account for all economic activity – they exclude the undeniably enormous value added of household production and care services.
The ECA decided to link the Continuous Household Surveys (CHS) to the ongoing national Income and Expenditure Surveys and Labour Force Surveys as an approach to systematically integrating gender perspectives and household production and services into economic analysis. This paper outlines the steps of building gender-aware microsimulation and macroeconomic models from time use survey data, which reflect the value added (Gross Household Product – GHP) of household production and services as compted from NSAHP.
Household production, which results from the combination of unpaid labour, goods, services and capital include: (i) unpaid services for own final use (domestic and care-giving services); (ii) informal sector production of goods and services for own final use by unincorporated enterprises owned by households (subsistence production and other kinds of informal enterprises); (iii) unpaid volunteer/informal domestic and care-giving services to other households; and (iv) production of housing services for own final consumption (imputed rents of owner-occupied housing). It includes activity groups 7-10 in the United Nations Trial Activity Classification System.
2. What are Continuous Household Surveys (CHS)?
Continuous household surveys (CHS) are quarterly, six monthly or annual national studies on time use and other household data of a representative sample size of not more than 5,000 households per country. In most developed countries, CHS are conducted monthly. The surveys would be used to generate gender-disaggregated data to understand the short-term dynamics between the household economy and the market economy over the fluctuations of the business cycle, and for constructing gender-aware macroeconomic models. The surveys provide a modern, scientific and cost-effective way to obtain timely statistics. The institution of regular (initially quarterly and now monthly) household sample surveys has been the major development of the past 30 years in Australia enabling the production of gender-disaggregated statistics on a wide range of issues (Ironmonger, 2003).
Being a representative sample of a few thousand households, CHS are only a fraction of the cost of a national census but are sufficiently accurate, often more accurate, than other survey forms covering millions of households3. Thus, the data could be available within three months (that is, June statistics available by the end of September and December statistics by the end of March, etc.).
A programme of action to establish CHS throughout all African countries is the essential starting point for the creation of modern, vigorous and up-to-date national statistical systems throughout Africa. The programme started in 2005 with an initial set of six countries of continuous, annual surveys of time-use and other household data. As a result, the first estimates of National Time Accounts (NTA) National Satellite Accounts of Household Production (NSAHP) and Gross Household Product (GHP) for the year 2005 have started for these initial programme countries. Gross Household Product is the total value added of household production, equivalent of GDP in National Accounts.
However, NSAHP and GHP depend on the collection of reliable data on the use of time. As our aim is to have national time account estimates on initially annual basis, then gradually quarterly basis, we plan to use detailed diary based and other instruments to establish the benchmark figures at say, five-yearly intervals and update the estimates of the broad divisions of labour and leisure by the annual or quarterly surveys using stylized questions. Unless surveys of time-use are conducted regularly, it will not be possible to extend the SNA on an annual basis to cover the productive activities of women (and men) in households. In many countries estimates of GNP and GDP are produced quarterly. This means that to produce estimates of GHP with a comparable frequency with GNP and GDP, time-use data will need to be collected on a quarterly basis.
Cooperation between the African statistical offices should enable economies of scale to be achieved in coding, editing, tabulation, publication and preparation of unit record files for research. Establishment of a central operations centre and processing facility is planned to facilitate the successful conduct of the first continent-wide time-use survey in Africa. As the new household-survey-based modern statistical system spreads across Africa, countries would re-adjust budgets to provide adequate resources to their national statistical organizations to conduct six monthly and then quarterly surveys. As part of this programme the African countries should produce two new statistical systems – NTA and NSAHP in addition to the existing National Accounts.
3. Specific Applications of Continuous Household Surveys
3.1 National Time Accounts (NTA)
National Time Accounts (NTA), which are a set of estimates of our total income and expenditure of time, similar to the estimates of national income and expenditure, which account for our market transactions in monetary units. A system of national time accounts (NTA) would provide a basis for international comparisons and for greatly improved modelling of our economic and social systems. A draft framework of NTA is presented in Table 1. Two new sets of data follow from the regular estimate of sets of national time accounts: (i) Regular household Input-Output tables, which are the NSAHP; and (ii) Regular estimates of GHP derived from NSAHP.
The principal benefit from the provision of regular national time accounts would be a more complete perspective and understanding of the role of households in the total economy, not only in regard to household productive activities, but also in relation to leisure activities and the interactions between the household and the market. The enhanced understanding of the dynamics of the economic and social systems in every country should provide a better basis for making policy decisions over a wide range of business and public affairs.
However, the development of NTA should be an interactive process between the model builders, the policy makers and official statistics offices, as it was in the development of the national income accounts and the uses of these accounts in model building and policy-making. Apart from the insights derived from international comparisons, comparisons over time of changes in the NTA aggregates will serve three main purposes (Ironmonger, 1993).
First, they provide a more complete understanding of households than is available from accounts, which focus solely on the use of money. The detailed activity classifications of the use of time available from the national time accounts will reveal changes in household work and leisure associated with the major changes in household technology, household demography, market incomes and market prices.
Second, national time accounts provide a better understanding of the total economy, which comprises not only market production from the formal sectors but also non-market production from the informal or household sector. As we know, non-market production by households is a very large aggregate and uses at least as much labour as market production. Unpaid work is a t least as large as paid work. The work input for the total economy is thus twice as large as what is currently measured as work. The hypothesis applied in this proposed programme is that through the business cycle, total work time is more stable than either the paid or the unpaid component.
Finally NTA, since they cover all of work and leisure, give a better basis for economic and social policy decisions than incomplete measurements, which concentrate solely on paid work in the market economy.
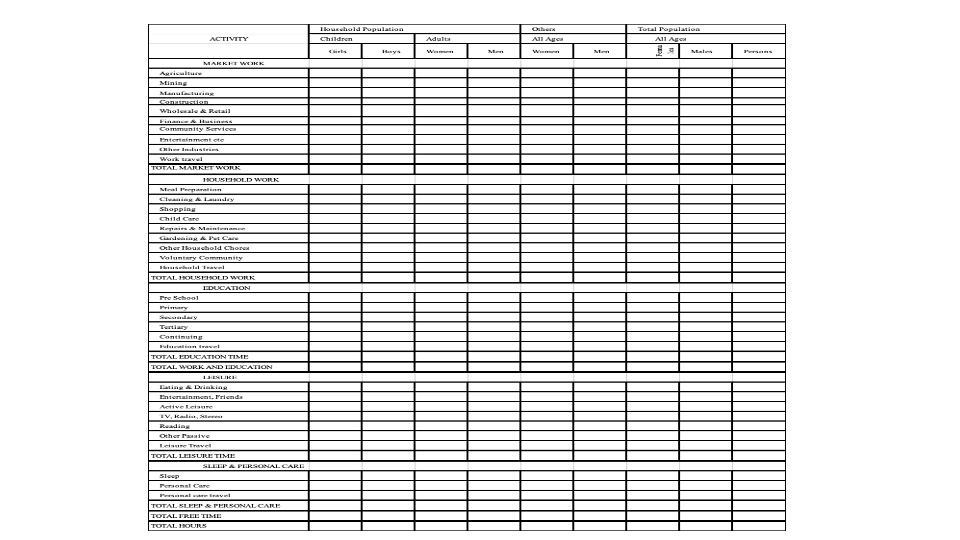
Table 1: Draft Structure of National Time Accounts National Time Account (Country) (Year) Millions of hours per week
Source: Latigo, A. (2005). ECA Guidebook on Mainstreaming Gender Perspectives and Household Production in National Accounts, Budgets and Policies in Africa.
3.2 National Satellite Accounts of Household Production (NSAHP)
The limitations due to the definition of the production boundary4 of the SNA do not preclude making estimates of the values of household production. The SNA 1993 has recommended compilation of satellite accounts with the SNA as the central framework for concepts and various types of analysis that are additional to or differ from those in the central framework. A satellite account provides a framework linked to the central accounts, and it enables focused attention on an aspect of economic or social life (for example, household production, tourism, environment and natural resources) in the context of the national accounts. Satellite accounts for the latter two have been developed for international use, while for household production is yet to be developed, especially for Africa, which needs special attention owing to its unique constraints and needs.
The NSAHP or Input-Output tables of household production, which are derived from NTA and income and expenditure accounts as well as from labour force statistics belong to the family of satellite accounts that are described by the 1993 UN System of Accounts (SNA) as accounting statements that are separate from, but conceptually consistent, with the core national accounts. Input-Output accounts of the household economy provide estimates of the total values of the inputs of labour, capital, energy and materials into the several sectors of household production. Household input-output tables extend the Leontief input-output framework of the national production accounts to show the complex interdependence between household and market activities in a more realistic way.
Construction and analysis of the outcome of NSAHP - Input-Output tables of household production using gender disaggregated data, as well as the integration of NSAHP into standard Input-Output tables or social accounting matrix (SAM) is the actual process of mainstreaming gender perspectives and household production in national accounts, budgets and policies.
The NSAHP for the first time in Africa attempted to bring together market economy and household economy in a common framework to measure the contribution of household production to the national economy. The aim of the NSAHP is to provide an overall picture of the productive activities undertaken by households and to give an estimate of the value of household production to obtain separate estimates of GHP. A small part of this production is covered by SNA, but most of it is not.
These estimates can then be used to trace the joint evolution and interaction of the two economies – the monetary Market Economy and the non-monetary Household Economy. If we wish to add the two economic magnitudes together to get a total measure of Gross Economic Product (GEP), we have to make a large reduction to the GNP/GDP estimates on account of imputed value of owner occupied housing which rightly falls in the non-monetary estimate, GHP. In Australia this adjustment is about 10 per cent of GDP to give another entity named Gross Market Product (GMP) (Ironmonger 1998).
Some researchers in this field have referred to the sum of SNA and non-SNA production as “extended production” (Goldschmidt-Clermont 1995). Gross Economic Product is the name for this extended value (GEP = GHP + GMP). NSAHP present data in such a way that they can be aggregated across the various categories of household production activities, and that they are compatible with national accounts data in order to describe and analyse the extended economy. Thus satellite accounts aim to achieve the following specific objectives:
To provide estimates of how households allocate time between paid work, unpaid work and leisure;
To provide for policy formulation a global view of gender-disaggregated statistics on productive activities by households and give an economic value of these activities most of which are undertaken by women; and
To estimate role/contribution of households to the total economy;
To improve data on work force/labour force in the economy and to improve data on GDP in this context;
To investigate gender equity, particularly in the context of sharing SNA and Non-SNA work by men and women;
To evolve social and economic policies and monitor these with the help of the time use data.
To use the satellite accounts as a data base for building gender-aware models to monitor and evaluate impacts of policies on poverty reduction and MDGs.
3.3 Types of Satellite Accounts of Household Production
SNA gives a wider range of freedom in producing satellite accounts than what is possible in the core national accounts (Eurostat, 2003). The household production can be measured and analysed in different ways and consequently, different satellite accounts may be developed: (i) using physical units such as time used for productive activities, (ii) number and type of goods and services produced; or (iii) by imputing monetary values to services produced. There are also options of extending the satellite accounts: only the value of household labour can be estimated, or the production and income generation accounts can be compiled. It is possible to go further and produce a full sequence of accounts where household production is integrated with the market production. An option may be chosen according to the purposes of the satellite account.
The NSAHP for South Africa is the first one of its kind in Africa (Table 2). However, the NSAHP, which was prepared from South Africa’s TUS, 2000 is just the basic Table in a "concise" format. Duncan Ironmonger presented similar formats of tables for Australia and Finland to the IARIW 24th General Conference in Lillehammer, Norway, August 1996. There are more detailed tables behind these concise tables where the detailed money expenditures from the Household Expenditure Surveys are distributed across the activity categories. To accompany the statistical results, an explanation of the methodology and the purpose of the Household Production Account needs to be written. There could also be comparisons made between the countries. In addition, given access to the unit record (microdata) files for both the Time Use Survey and the Household Expenditure Survey, it is possible to prepare further tables for different categories of households such as rural and urban, with children and without children, or high income and low income. It is expected that in 2006 when the six African countries will all have undertaken their time use studies, different types of NSAHP will begin to emerge.
3.5 Gender-aware Micro-simulation and Macroeconomic Models
Continuous household surveys provide gender disaggregated data (GDD) for regular preparation of NSAHP, which in turn could be used by policy analysts for integration into standard Social Accounting Matrix (SAM) to make this framework not only gender-responsive but to incorporate half of the total economy (household economy), which traditionally have been omitted in macroeconomic analysis. The 1993 SNA defines a SAM as “the presentation of SNA accounts in a matrix which elaborates the linkages between Supply and Use tables and institutional sector accounts”. It is a consistent quantitative macroeconomic data framework of an economy in a specified period of time, usually one year.
Based on NSAHP developed from time use studies in South Africa, ECA in 2004 and 2005 developed the two types of models to evaluate impacts of policies on poverty reduction and this work is being extended to monitor implementation of MDGs.
4. Other Data Needed for Use with Time Use Data
4.1 Supply and Use Tables
The Supply and Use Tables (SUT) are a synthetic presentation of the economic data contained in the System of National Accounts (SNA) of the origin and destination of goods and services available in a given economy during a specific period. It is an accounting framework that ensures the numerical consistency of data obtained from different sources (industrial surveys, household surveys, investment surveys, foreign trade statistics, etc.). Commodities available in the economy are produced locally and imported. Industrial output and import are valued at basic price, and c.i.f. (cost, insurance, and freight) price, respectively; whereas final demand is valued at purchasing price. Therefore, the consistency between the industrial output level and import, and the final demand pass by taking into account transaction charges, i.e. levies and taxes, duty, and trade and transport margins. In the SUT, the resources available in the economy are used for final consumption of households and Government, for intermediate consumption and export, and for fixed capital formation and change in stocks. The SUT incorporates an Input-Output matrix of intermediate consumption presenting intermediate consumption by product (in row) and intermediate consumption by branch (in column). The industry production and value added (compensation for employees, gross operating surplus and mixed income, taxes and subsidies on production) are also recorded in the SUT.
The example below of the South African SUT for 2000, are estimated by Statistics South Africa according to the recommendations of the 1993 System of National Accounts (1993 SNA). It presents two separate and interdependent tables: a Supply Table (Table 2) and a Use Table (Table 3).
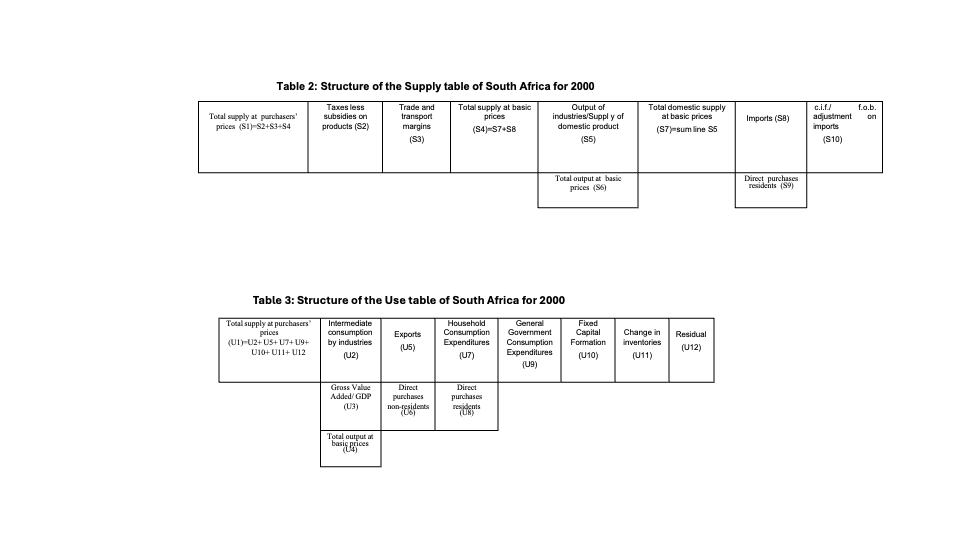
The main part of the Supply table is at basic prices, but there are columns added so as to arrive at total supply at purchasers' prices in order to balance with the Use table at purchasers' prices. The cornerstone of the supply table is the industrial production or supply of domestic products (S5), which has 94 industries (in column) and 153 products (in row). Industrial output consists in a primary product and, sometimes, one or several secondary products. Consequently, the domestic supply of a given product (S7) could be drawn from several industries. Total Supply of a product at basic prices (S4) is equal to the addition of the domestic production value at basic price (S7) and the import from abroad valued at c.i.f. price (S8). The supply table is at basic prices, therefore, there are columns added so, i.e. trade and transport margins (S3) and taxes less subsidies on products (S2), as to arrive at total supply at purchasers' prices in order to balance with the use table at purchasers' prices. Furthermore, the Supply table presents a c.i.f. / f.o.b. adjustment on imports (S10) in order to adjust the total imports value. There is also an account for direct purchases of residents (S9) that adjusts total imports.
TThe Use table redraws the destination of total industrial products and imports recorded in the Supply table. The total output (U1) is used for the intermediate consumption (U2), exports (U5), final consumption of household (U7) and public administrations (U9), fixed capital formation (U10) and change in stocks (U11). A residual account (U12) records the difference between the total supply and total use for a given product. The Use table also presents the structure of the industrial production, in term of intermediate consumption presented by the input-output matrix (U2) and the added value (U3) imputed to compensation for employees, gross operating surplus and mixed income and taxes and subsidies on production. The use table has 95 products accounts (in row) and 94 industrial accounts (in column). It presents an account for the direct purchases of the non-residents (U6) and of residents (U8), transactions recorded in the exports and imports accounts, respectively, and in the final consumption of households5.
4.2 The Integrated Economic Accounts for 2000
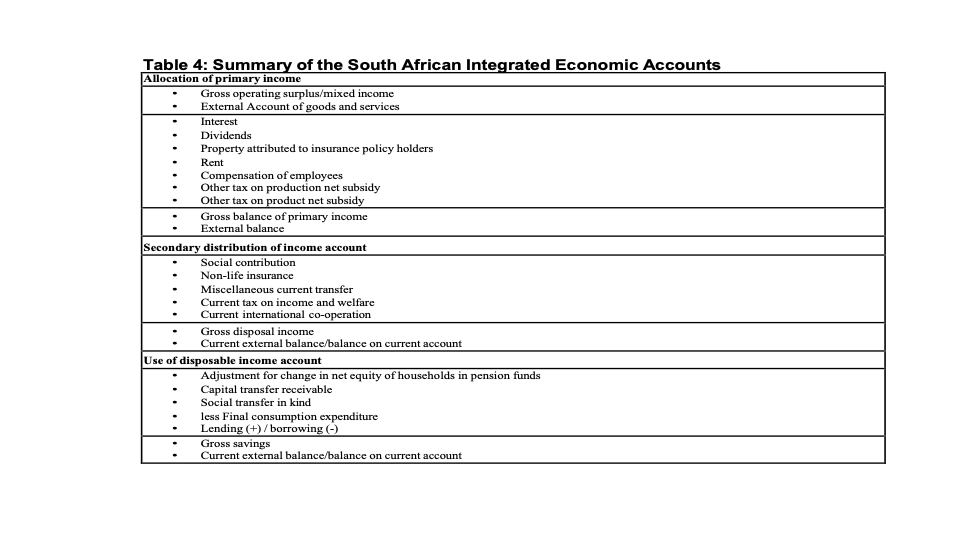
The Integrated Economic Accounts (IEA) framework is a set of ordered economic accounts describing the process of income generation through distribution and accumulation of the institutional sectors. It gives a synthesis of the economic transactions of the institutional sectors grouped into five categories on the basis of their principal objectives, function and behavior. The IEA summarizes the SUT transactions (industries’ transactions, income and expenditure of institutional sectors) with additional information on inter-institutional transfers and savings-accumulations. For details on the SU-tables, see Final supply and use tables, 2000: an input-output framework / Statistics South Africa. Pretoria : Statistics South Africa, 2003.
5. Procedures Used in Applying Data from Continuous Time Use Studies in Building Gender-aware Models
The different steps followed in developing a gender-aware from time use data are depicted in Figure 1 below (ECA, 2005).
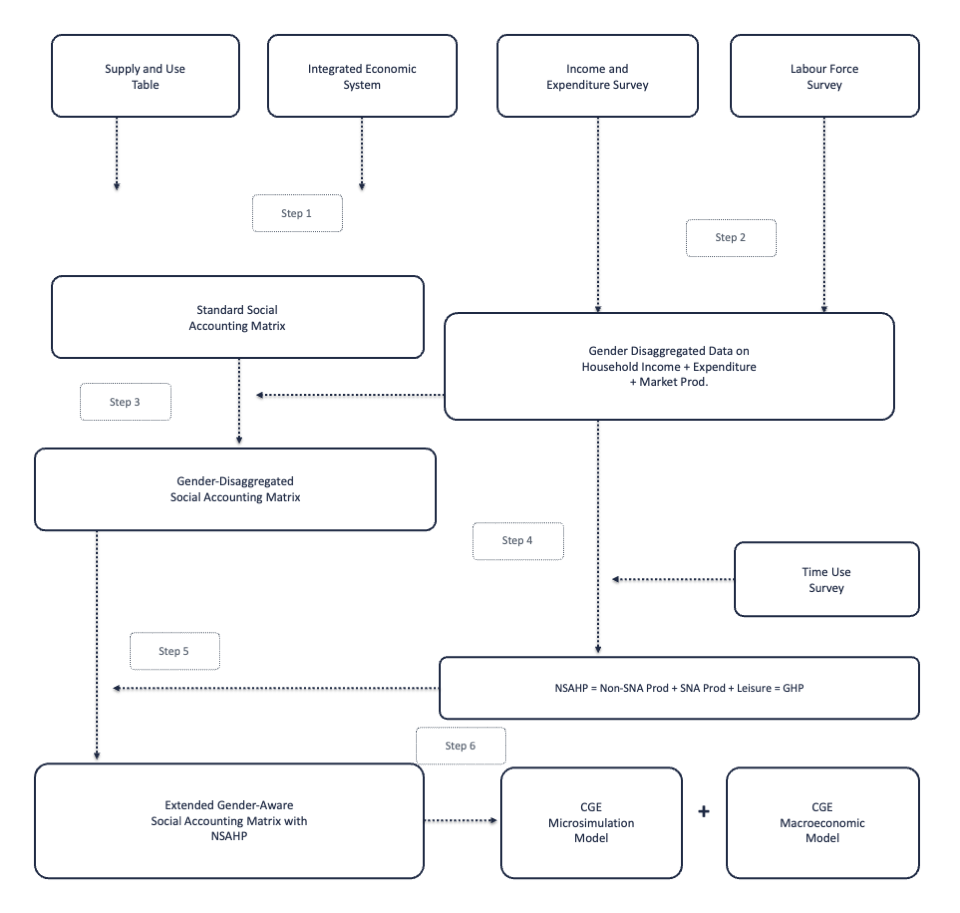
Figure 1: FROM NATIONAL SATELLITE ACCOUNTS OF HOUSEHOLD PRODUCTION TO GENDER-AWARE MODELING
Step 1: Construction of the Standard Social accounting Matrix (SAM)
Therefore, the first step in developing gender-aware micro-simulation and macroeconomic models based on Computable General Equilibrium (CGE) model is to build a SAM that integrates traditional market activities, non-market production and consumption exclusive to households, and leisure time activities of its members. The Supply and Use Tables (SUT) and the Integrated Economic Accounts (IEA) for the same year are integrated into a single framework: the standard Social Accounting Matrix (SAM). “A SAM is a square matrix in which each transactor or account has its own row and column. The payments (expenditures) are listed in columns and the receipts are recorded in rows. As the sum of all expenditures by a given account (or sub-account) must equal the total sum of receipts or income for the corresponding account, it follows that row sums must equal the column sums of the corresponding account” (Thorbecke, 2001). A social accounting matrix is a linked set of statistical tables which provides a schematic portrayal of the circular flow of income in the economy at a single point in time, including activities and commodities, factors of production, and certain institutions. It makes possible the determination of balances for all commodities and budget constraints for all agents. The structure of a SAM reflecting its sources of information from SUT and IEA is presented in Table 4. To build the standard SAM for year 2000 for South Africa, we focus on the 2000 accounts summarised in Table 3.
Table 4: Structure of a Standard SAM
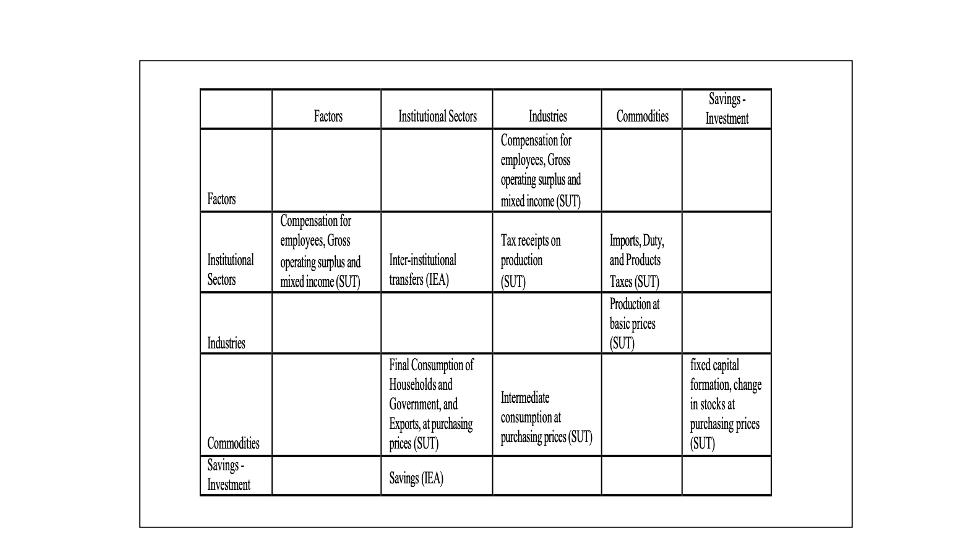
Table 4: Structure of a Standard SAM
Step 2: Computation of Income and Expenditure data as well as male and female market work
Household expenditure includes market purchases of goods and services and the consumption of own-produced goods valued at purchaser and sale prices, respectively, interest and rent paid, social contribution and non-life insurance expenses, miscellaneous transfer payments, income and welfare tax payments, and investment expenditures. Data from the household survey features as many as 48 income variables both at individual and household levels.
Step 3: Disaggregating labour account in the Social Accounting Matrix by gender, age and skill.
The standard SAM presents a single labour account. Most standard CGE models make the implicit assumption that male and female workers are perfect substitutes in market production and thus do not distinguish them, although many studies mention segmentation in the labour market between men and women, and different levels of market work flexibility according to the domestic tasks they perform. Also, it is observed that male and female workers tend to concentrate in different sectors and occupations, which further undermines the hypothesis of perfect substitutability. In a gender disaggregated SAM the labour accounts (which might include more than one category of workers) are disaggregated into male and female labour accounts. Workers receive income from services provide to industries in the form of wages. Male and female wages then constitute labour income for households. By integrating gender disaggregated data in a standard SAM, the labour accounts (which might include more than one category of workers) are disaggregated into male and female labour accounts.
We also disaggregate workers by age with the motivation that macroeconomic policies and shocks that impact on the time allocation decisions of adults also affect those concerning children, i.e. child work, leisure and education time, particularly at the household level. If children, especially girls, are required to assume household tasks of female adults who have entered the labour market, their leisure and education time could be negatively affected.
Finally, we distinguish workers by skill. There is a general consensus among analysts that the labour market is segmented in different countries. Each segment corresponds to a skill-level and performs differently in term of earnings, job opportunity and unemployment, wage flexibility, etc. Consequently, the labour accounts of the gender disaggregated SAM is decomposed into several categories based on age, skill, region and gender of the individual.
Step 4: Generation of National Satellite Accounts of Household Production (NSAHP) from Time Use studies
The simplest form of household NSAHP which is an input-output table can be prepared by combining the data from a household expenditure survey (HES) with the data from a household time use survey (TUS) (Ironmonger, 2003). This was done first for Australia by combining the 1975-76 HES with the 1974 TUS (Ironmonger and Sonius, 1987; 1989). The columns of the table are the various activities such as meal preparation, cleaning, laundry, child care, shopping, repairs and maintenance, and gardening. The rows of the table are the inputs of materials, energy, services, labour time and capital equipment (including housing) absorbed in each of the listed activities. With appropriate valuation of the intermediate, labour and capital inputs, the total of each column gives the monetary value of the total output from that activity. An important feature of the methodology, which uses the micro-data from household surveys of time use and expenditures is that input-output tables can be prepared for different sorts of households. These permit more detailed analysis of the structure of the household economy, including economies of scale and equivalence scales covering not only the usual inputs of purchased commodities but also inputs of time (Tran Van Hoa and Ironmonger, 1989).
Step 5: Extending the Gender-disaggregated SAM with NASHP
We extend the South African gender disaggregated SAM to incorporate non-market activities (unpaid domestic work, leisure and personal-care time) in the structure of a standard SAM
using National Satellite Accounts of Household Production (NSAHP) as suggested by the United Nations 1993 System of National Accounts. The Gender-aware SAM integrates male and female time allocation between market (wage and self-employment work, and unemployment time) and non market activities (unpaid domestic work, leisure and personal-care time), and the home produced good or household production of services. Home good production involves male and female labour. By assumption, it requires neither intermediate goods nor capital directly. Substitution and complementarity between gender domestic work and, factors and intermediate market consumption are captured in the household direct utility function. The value of home produced goods is equal to the value of the labour devoted to its production where non-market labour is valued at its opportunity cost as measured by the market wage rates.
Step 6: Construction of a gender-aware model based on the gender aware SAM
Construction of a gender-aware model based on computable general equilibrium model requires a consistent data set in terms of an extended gender-aware SAM. This process does not interfere with market activities. The final step is to use the extended gender-aware SAM as the main database for constructing the gender-aware models. The success in developing the model is owed first of all to the Africa-wide recognition of the importance of generating GDD and the Ministerial resolution urging African countries to undertake time-use surveys to generate GDD. The success is also due to concerted efforts and resources that have been invested in these tools. It is also due to the result of contributions made in expert group meetings by a team drawn from national and international statistical institutions involved in gender issues and household economy. The first Expert Group Meeting, which was held in 2002 reviewed and validated the analytical and conceptual framework for developing the model and other tools.
6.0 Results from the NTA, NSAHP and Gender-aware Models
The following results can be summarised from the application of time use data:
The NSAHP for the first time in Africa attempted to bring together market economy and household economy in a common framework to measure the contribution of household production to the national economy.
The gender-aware SAM was able to demonstrate numerically that women’s contribution in non-market production in South Africa is almost double that of men and that women have 30-50% less time for personal care and the leisure than men at the household level.
The development of NSAHP and gender-aware SAM further demonstrate success in mainstreaming gender perspectives and household production in national accounts, budget and policies. This is a direct contribution to the implementation of the strategic objectives and action plans of the Beijing Platform for Action (1995) and UN 1993 System of National Accounts (1993 SNA). The NSAHP also shows that household production constitutes about 44% of the total economy, which is not included in the GDP assessment.
Elimination of import tariffs in South Africa would reduce real wages for women by more than double that of the male counter parts.
Elimination of tariffs would also reduce labour market participation by women while increasing that for men.
Trade liberalization would increase time burden on women in that they will spend roughly three times as much time in household production as men.
All the above strong results would go unnoticed if the SAM and the model were not gender-disaggregated.
The above results from the development NSAHP, gender-aware SAM and gender-aware model can now be used to guide policy makers in addressing issues relating to non-market activities performed mostly by women. The following examples could be the kind of policy interventions that would emerge from the application of these tools.
Counting household production and women’s contribution to the economy through NSAHP would ensure comprehensive, sound policy making and budget formulation, as now national policies and national budget would be based on information on total economy and not on only about 50% of the economy when household production is ignored.
The information revealed from this kind of work would enable development stakeholders in Africa to capture the benefits from counting household production and hence be able to officially recognize household economy as a necessary part of sustainable development strategies. African Governments would also be convinced to reform their statistical system to introduce regular time use studies including other household surveys to generate vital gender-disaggregated data. They will thereby adopt preparation of NSAHP to provide a database for strategic planning and policy formulation and analysis. Introduction of gender responsive budgeting and modification to fiscal policies would also follow.
As regards specific results of the modelling work, to reduce time burden on women, it is important for the government to design complementary policies through measures that save time or improve productivity of time use such as women’s access to education, land, finance, information and technology.
The government could also put in place compensatory taxation that benefits poor household women to offset income losses due to increase in taxation and reduction in wage rate for women. This will lead to equitable income distribution among women and men thus, contributing to poverty reduction and improvement in welfare.
CONCLUSION
The development of the model and the analysis that followed has generated important results and intuitions from which different conclusions can be made for policymaking – an analysis that would go unnoticed in standard non-gender-aware models. In particular, it contributed to better understanding of policy impacts and different policy responses and investment priorities by gender for poverty alleviation. The model is accepted and is being used by the National Treasury in South Africa. The South African Government in a letter to ACGD appreciated this initiative and indicated that the gender-aware model has deepened its understanding on the impacts of trade liberalization on women’s lab our market participation and welfare among other key revelations. And that this initiative is expected to improve the welfare of women, men and children by directing policy actions including programmes and resources to address gender-related household production obstacles to national development. This pioneering work, which is on-going in initially five other countries during 2005-2006 aims to contribute to the reform by African Governments of their National System of Accounts to collect regular GDD.
The development of gender-aware models from time use data is one step towards filling the gap in gender-aware macro-economic analytical tool for evaluating impacts of policies on poverty reduction and welfare. This work has opened way for examining more macroeconomic policy variables such as public expenditure, value added tax (VAT), sales tax and their impacts on income distribution and poverty reduction.
References cited
Commission of the European Communities – Eurostat, International Monetary Fund, Organisation for Economic Co-operation and Development, United Nations, and World Bank
System of National Accounts 1993, ISBN 92-1-161352-3, Brussels/Luxemburg, New York, Paris, Washington
ECA (2005) Technical Report on Building a Gender-Aware Social Accounting Matrix Incorporating Household-level Data: The case for South Africa
ESCAP (2000) Analyzing Policy implications of Time Use Data: a Framework Paper
Eurostat (2003) Household Production and Consumption: Proposal for a Methodology of Household Satellite Accounts
Goldschmidt-Clermont L and Pagnossin-Aligisakis E 1995 Measures of unrecorded economic activities in fourteen countries Human Development Report Office Occasional papers 20, United Nations Development Programme, New York
Hamermesh, D.S. and Pfann, G.A (2005) The economics of Time Use. Elsevier
Ironmonger Duncan (2003)National Time Accounts: The dynamic modeling of time use using continous time use surveys. The 25th IATUR Conference of Time Use Research, 17 – 19 September 2003, Brussels, Belgium.
Ironmonger Duncan (1996) Counting outputs, capital inputs and caring labor: estimating gross household product Feminist Economics 2(3): 37-64
Latigo A and Ironmonger (2004) The Missing Link in Growth and Sustainable Development: Closing the Gender Gap, Issues Paper, Economic Commission for Africa